Projects / Hierarchical data in Mathematica
Introduction
For Mathematica 11, I contributed the the new Dataset construct in Mathematica, which acts as a flexible container for tabular data. It involved a lot of interesting challenges around automated layout and deduction of types from unstructured data.
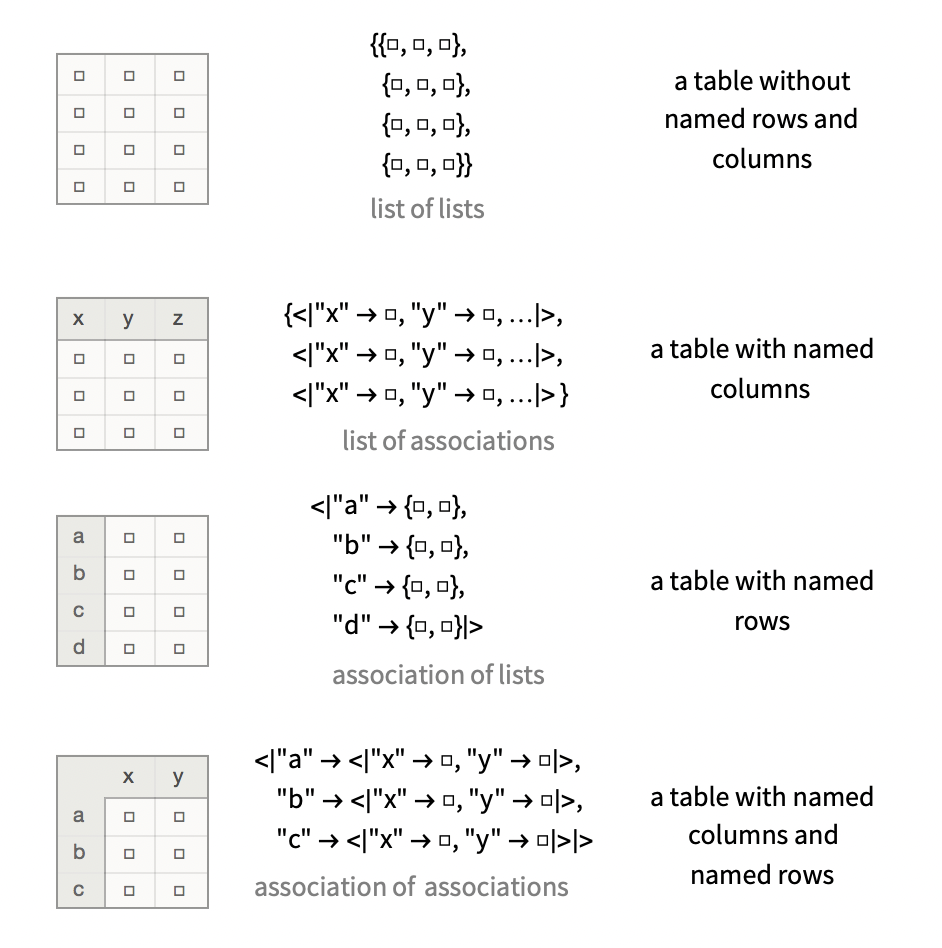
The underlying technology scales to quite complicated nested use of Mathematica’s two native data structures, being lists $\{v_1,v_2,...\}$ and associations $\left<\left| k_1 \to v_1,k_2 \to v_2,... \right|\right>$. Because Mathematica is a dynamically typed term-rewriting system, these structures are commonly used for both homogenous containers (vectors, hash-maps) and heteregenous containers (tuples, records). Dataset uses an internal algebraic data type system that imposes a type when given unstructured data, attempting to find one that somehow “maximally explains” the value that it is given, but can adapt to mixed scenarios.
Nevertheless, this picture can explain how various simple kinds of data are displayed:
Planets
As an example, let’s look at the “planets” dataset, which contains an association of names planets, each of which itself has a “Moons” field with an association of named moons.
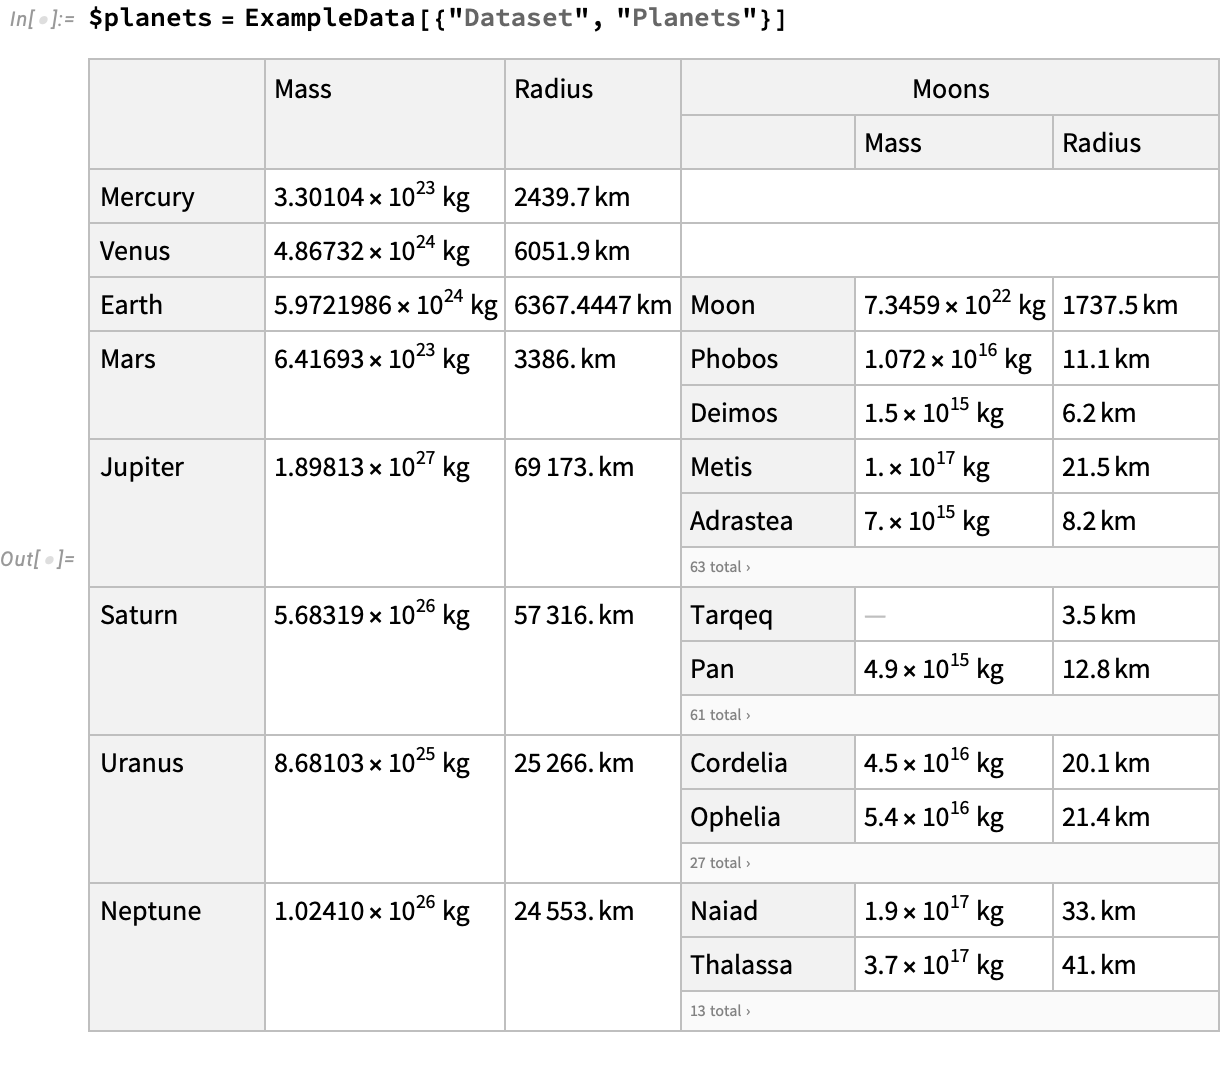
The outer table is in fact not a list of rows but a hash-map / record (or association) of rows, indexed by a unique key given by the name of the planet. We can examine the underlying data for Earth, after it has been stripped of the Dataset container:
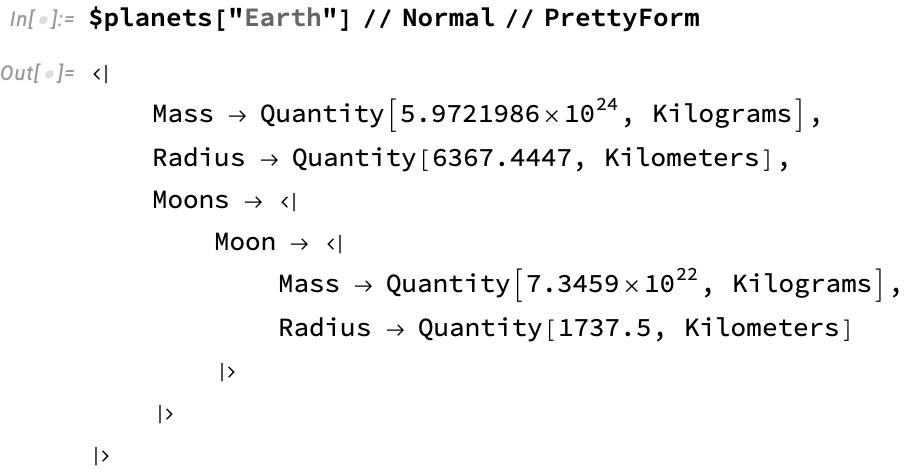
Notice that this single “row” is an Association (indicated by the <|...|> syntax), whose keys are “Mass”, “Radius”, and “Moons”. The value of the “Moons” key is itself is another entire table, in this case with one entry. The original displayed form automatically chose to display this entire sub-table by splitting the corresponding header into sub-columns, and tiling the rows of the sub-table down these entries.
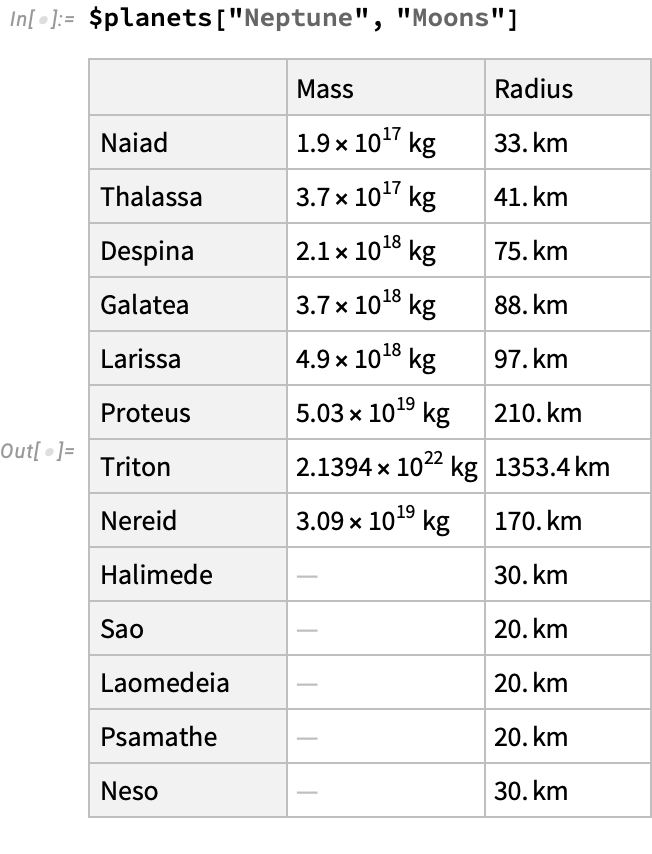
Let’s access this subtable for Neptune, which is a simpler kind of table that doesn’t contain any nested data structures:
Algebraic Data Types
How was the complex display form of the original data chosen? We start by exploiting the fact that the data is structured in some regular way. For example each planet has a “moons” field that consists of an association of records that all share the same keys (Mass, Radius), and typesof value (quantities with units kilogram and kilometer). We can create this automatically when the dataset is first synthesized by searching a space of possible types that describe the data, ranging from a sort of “cop out” type that matches any data, to progressively more refined types that can account for more of the nested internal structure of the data. Doing this optimally is a complex search process that requires (at least conceptually) maximing some kind of score that expressses a trade-off between precision (how narrowly our types fit the data) with complexity (how elaborate the resulting type is, e.g. does each planet get its own type?).
Let’s see the underlying type for the planets dataset:
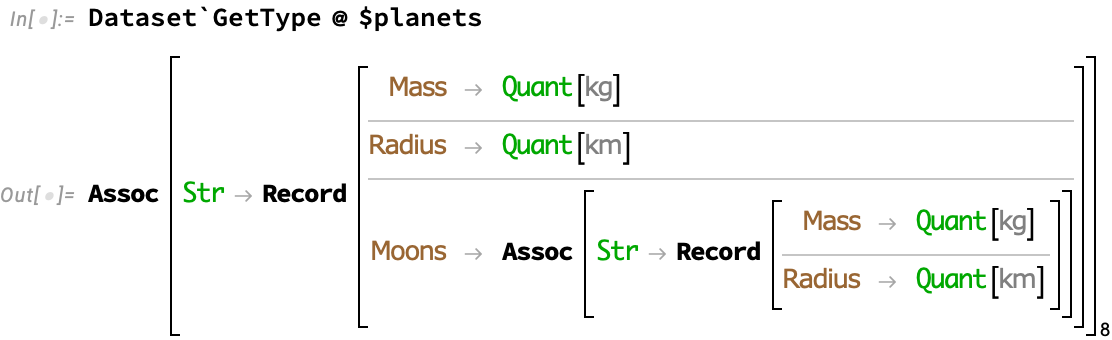
This says: eight planet rows are indexed by a string name (the planet), and have fields of mass, radius, and moons. The moons field is another such indexed table with two further fields describing the moon.
For both the planets and their moons there is a “template” of the form Assoc[Str Record[...]] that lends itself to layout as a table of named columns and named rows.
Titanic dataset
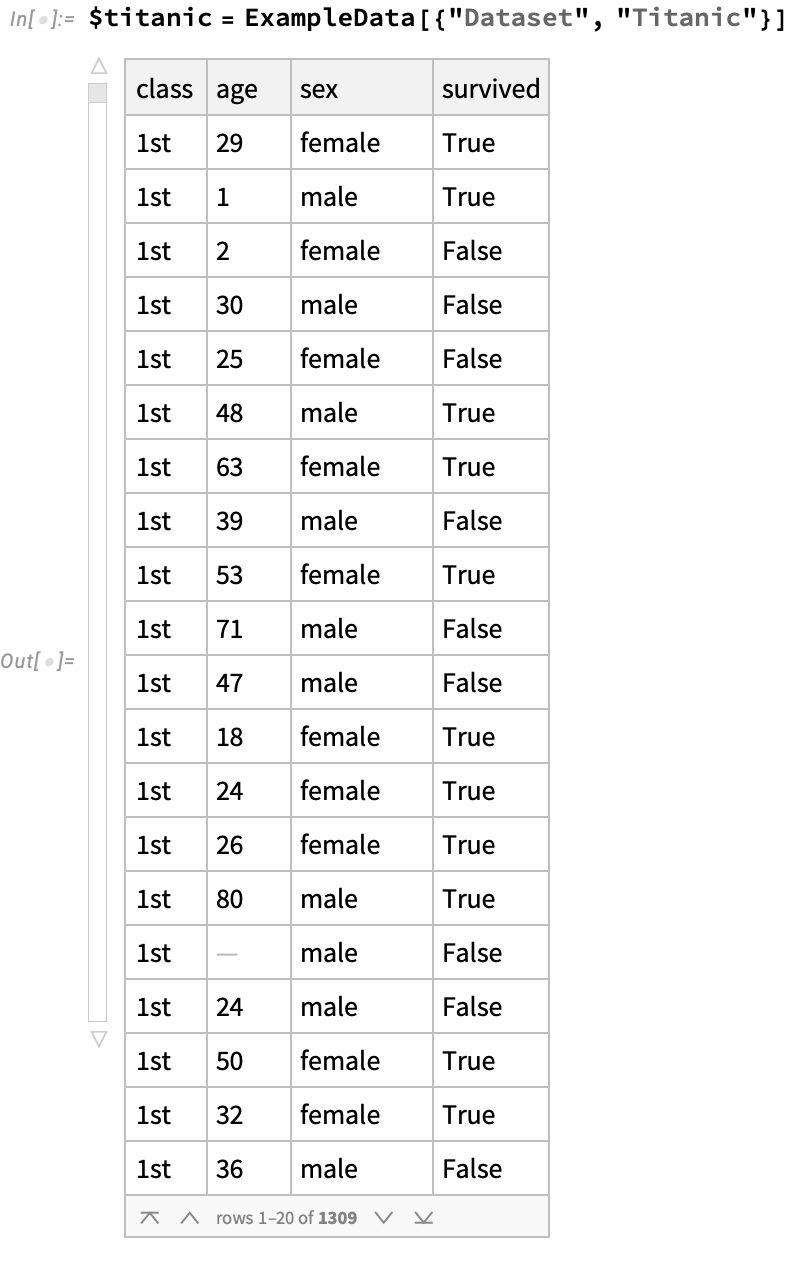
Let’s look at a more traditional tabular dataset, corresponding to the demographics of passengers on the doomed Titanic:
Here, the type is more straightforward, consisting of a list of records.
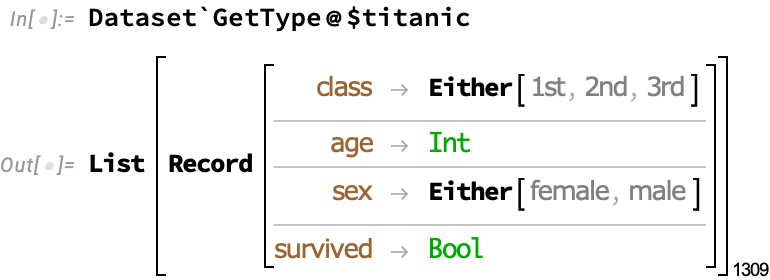
In this case, there is a “template” of the form List[Record[...]] that lends itself to layout as a table of named columns and anonymous rows.
Other examples
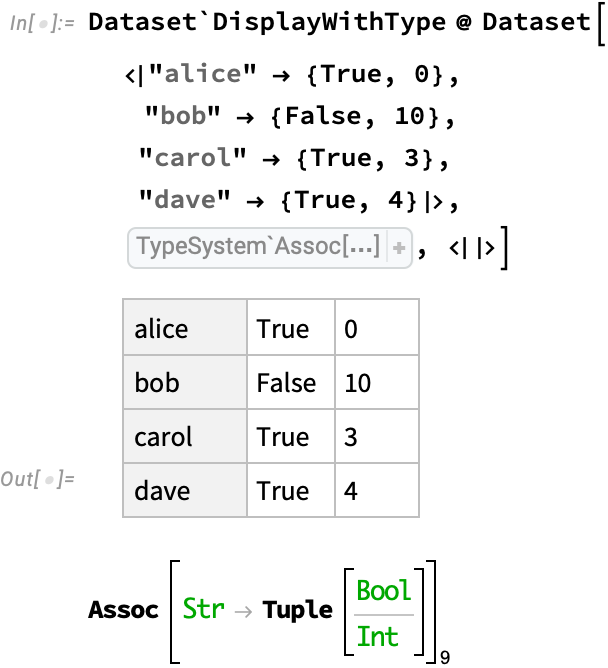
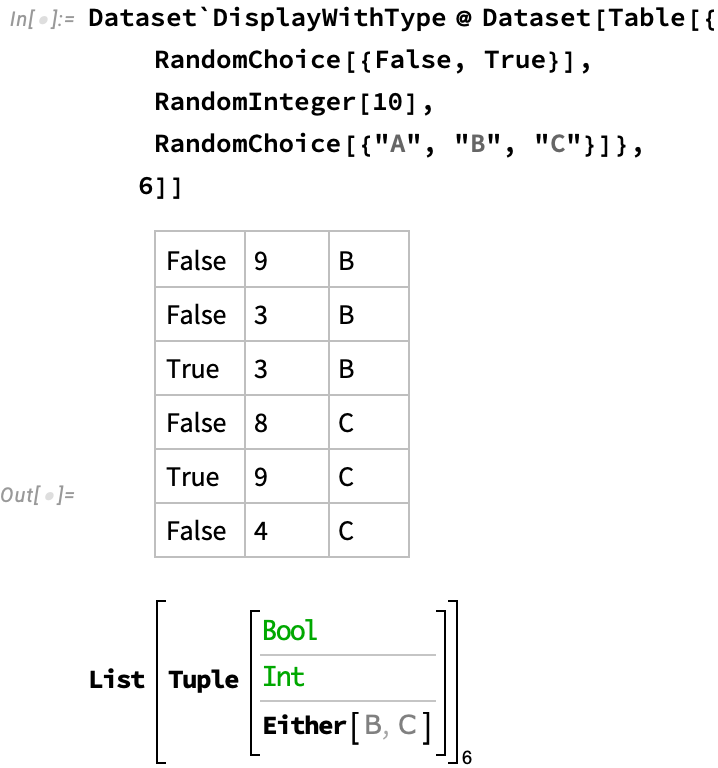
But many more variants are possible, like named rows and anonymous columns, corresponding to an association of lists:
Or rows and columns that are both anonymous:
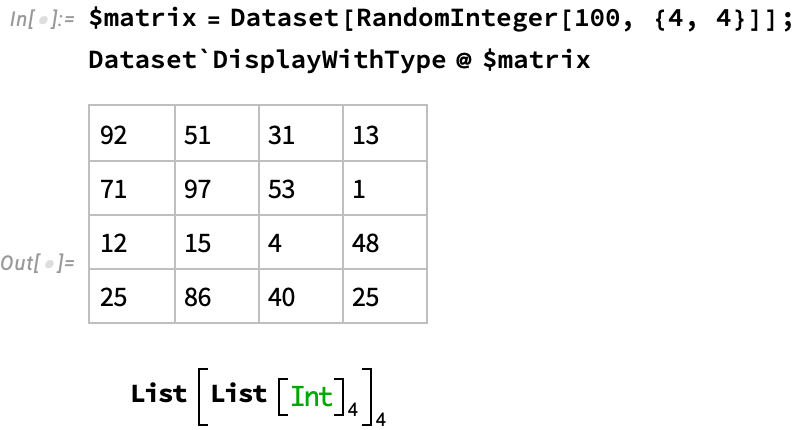
Or as a special case, an matrix of uniformly typed values:
Layout
In all of these cases, the tabular layout was computed automatically by searching a space of possible layout gadgets, which are composable machines that express a particular layout strategy. These are parameterized by settings such as how many rows of a sub-table to show, how each row and/or column should be rendered, whether to use vertical or horizontal layout. Some super-gadgets like the table gadget can contain row, column, and cell sub-gadgets. Once a gadget actually operates on concrete particular data it will construct a summarized representation that can be typeset into a two-dimensional table. Super-gadgets will parse their input data and feed it appropriately to their subgadgets.
But for super-gadgets to choose their parameters, and their constituent sub-gadgets, they must estimate how wide and long each particular cell of a table needs to be to adequately display its contents. This allows them to balance the requirements of their different constituents in order to achieve an optimal overall layout that respects the visual constraints of the final display. Hence super-gadgets to sample the data that is actually there.
So the display problem is quite challenging: we have a combinatorial explosion of potential layout gadgets, and each candidate solution can have potentially inifinite range of parameter settings. To make things worse, parameters can often be traded off against one another in complex ways, e.g. how many rows of an inner nested table to display can be traded against how many rows of the outer table can be displayed. So producing a single final score for these solutions requires some weights chosen by trial-and-error to satisfy aesthetic preferences.
The principled solution to this optimization problem would involve something like a beam search. Here, we maintain a set of partial candidate solutions that are gradually elaborated until they are fully specified, with pessimistic estimates of their final score updated as they are elaborated and used to guide a search. This is similar to how the game tree for a game of Chess or Go is explored by algorithms like AlphaZero. This way, solutions that are initially estimated to be sub-optimal but that later turn out to be optimal are not prematurely discarded.
However, time constraints forced me to rely on a greedy algorithm that used a certain small amount of back-tracking when the initial greedy choice was determined to be clearly sub-optimal.
Titanic
Here we show the shape chosen for the titanic dataset, which is a standard table:
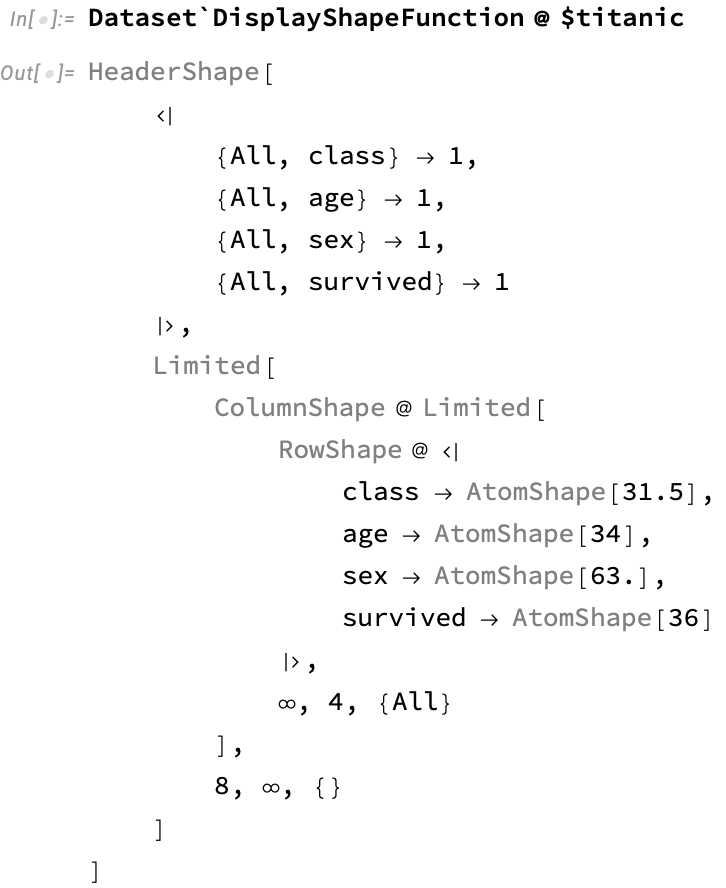
The HeaderShape gadget produces named columns that correspond to the entries of individual records (e.g. the {All, "class"} is a kind of lens that slices out these values). The Limited gadgets control how many items from each sub-part of the data should be taken before the rest are elided, and takes care of creating interactive widgets that allow scrolling through the data. ColumnShape produces a vertical list of entries, and RowShape produces each horizontal row by applying the given gadgets to the fields of each association. These individual gadgets contain width specifications that were chosen by sampling from the corresponding fields – one reason we do this is to ensure that scrolling through a very large dataset does not cause columns to jump around in size due to the particular data on screen being shorter or longer.
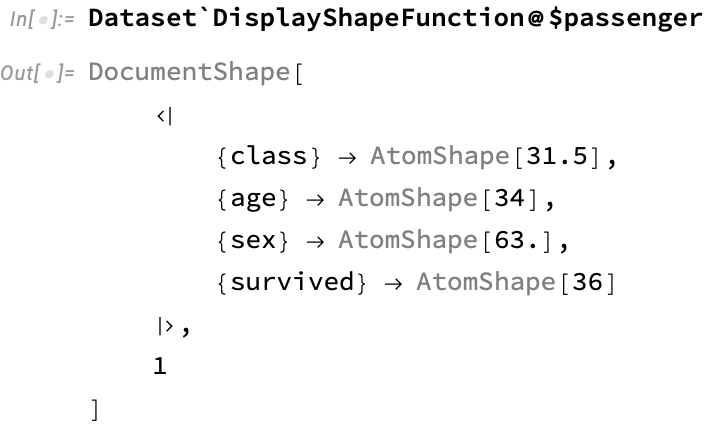
Let’s pick out the first passenger from the titanic dataset:
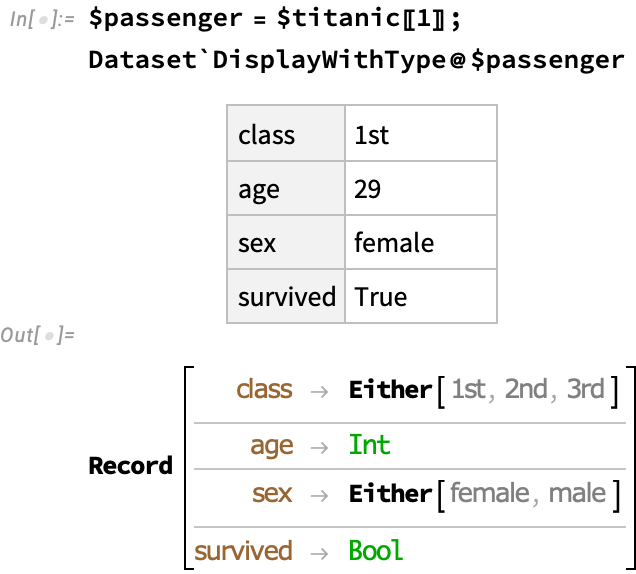
The DocumentShape gadget here uses rows to display fields, rather than columns, since this is more readable for this kind of data. This is essentially just a transposed form of HeaderShape:
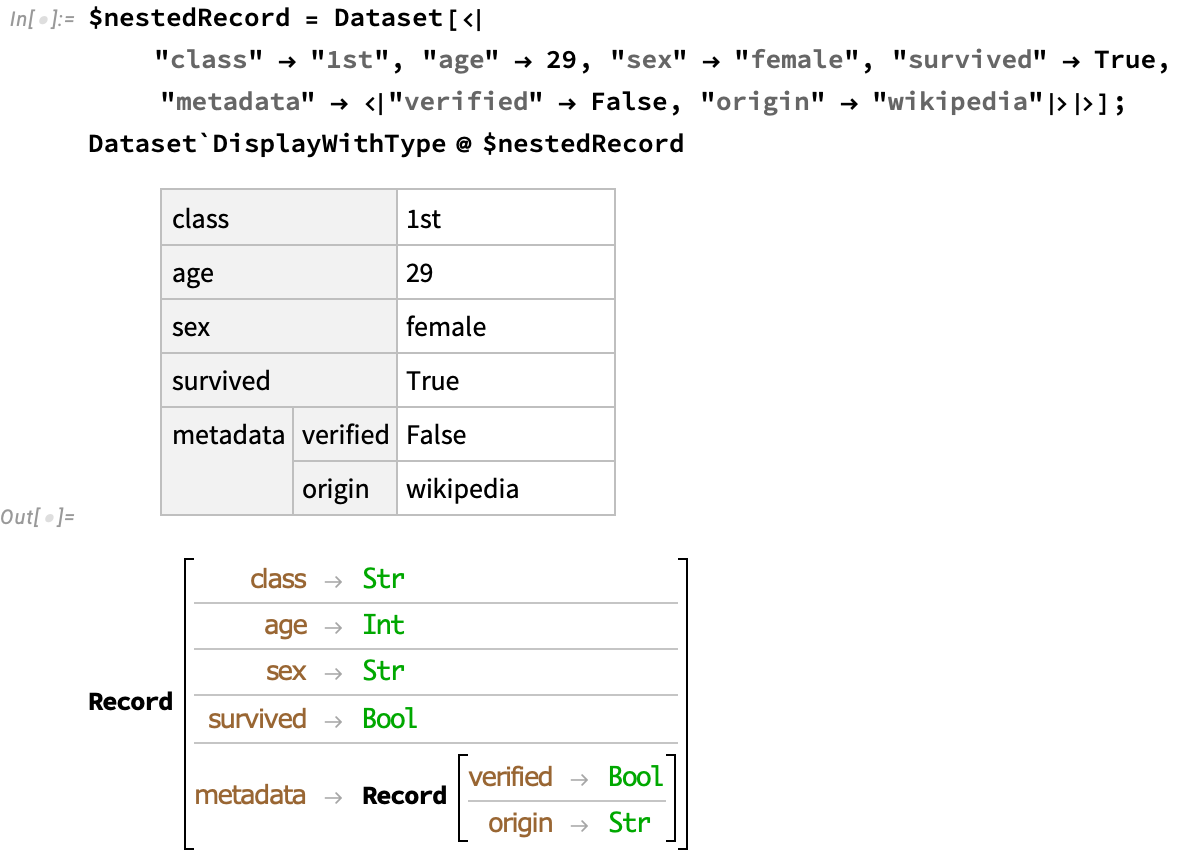
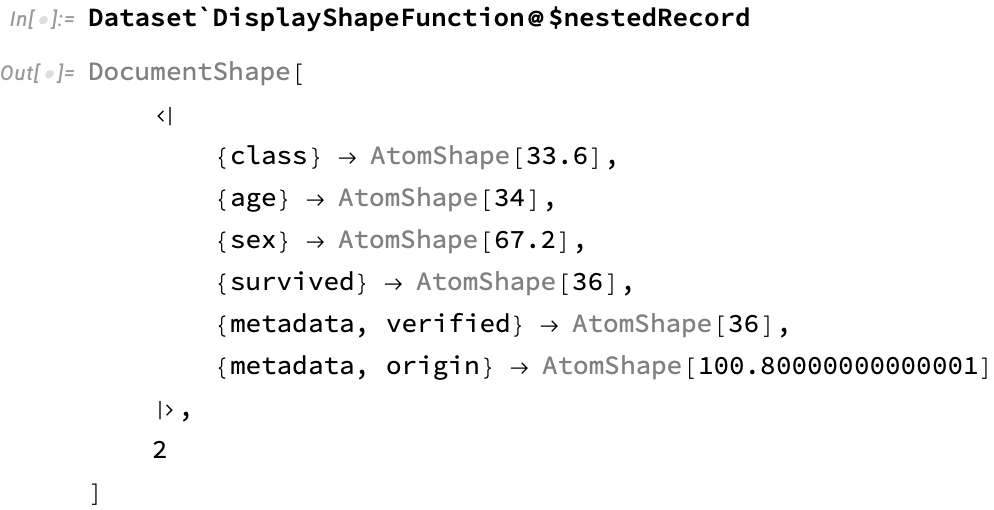
Nested records
This scales nicely to the common case of JSON-like situation of nested records:
Notice the two-element lens that is used to obtain subfields:
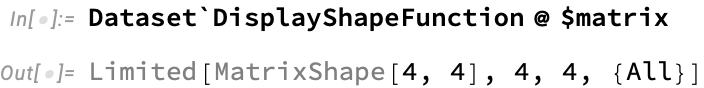
Matrix
For the matrix example, a custom gadget is used that is specialized to deal with matrices, for which we want the columns to be displayed with equal size:
Planets
As a much beefer example, we can look at the gadget for the planets dataset:
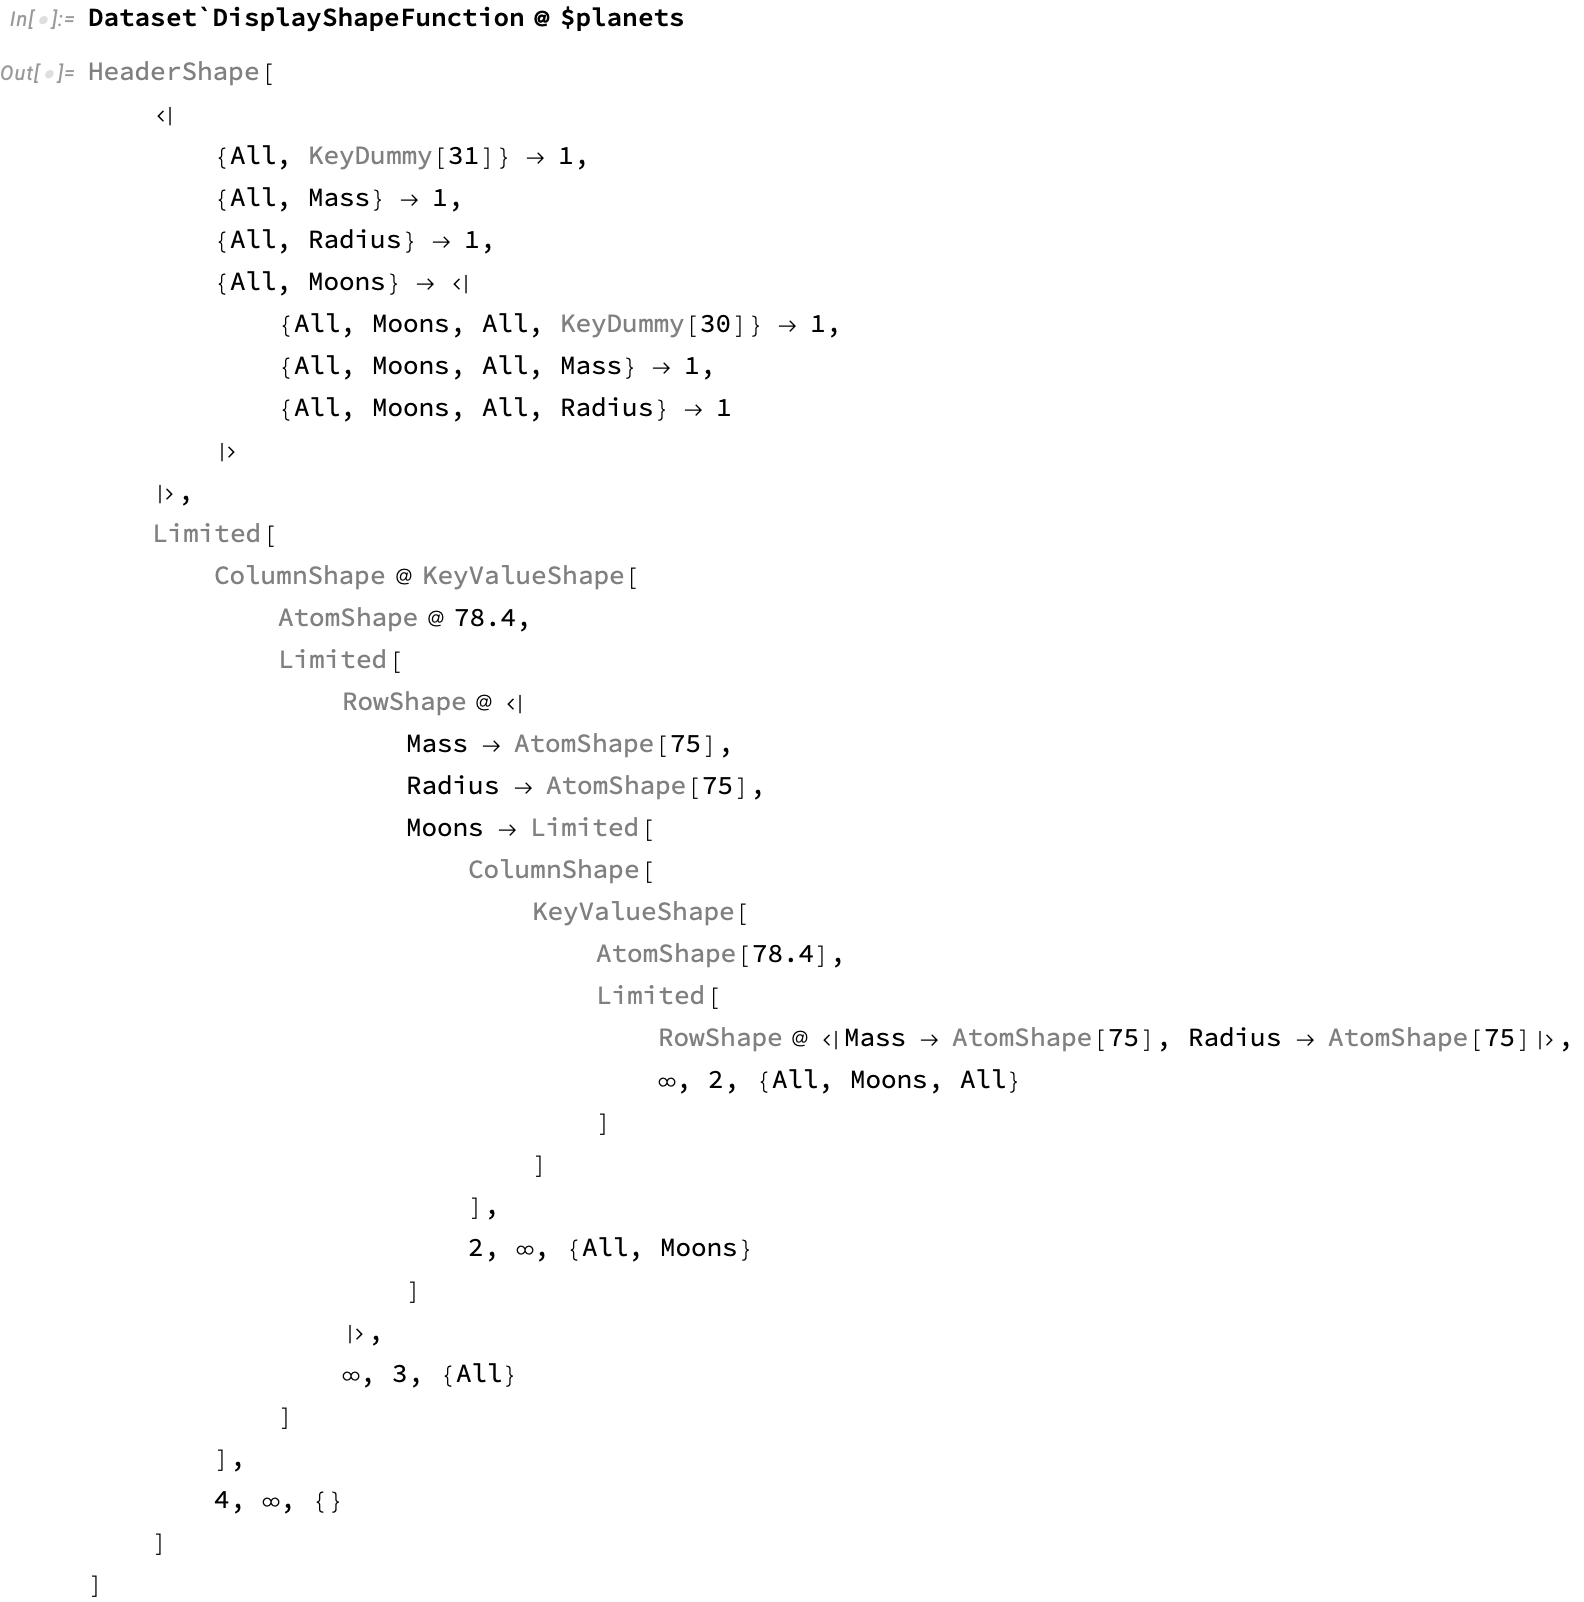
Notice how theHeaderShape contains a nested specification for the columns that constructs the sub-columns that list the properties of each moon.
Interactivity
Along with the display of nested data sets, it was desirable to allow the user to interactively “drill down” into particular views or slices of the data. Here’s a demo of this feature in action:
Query syntax
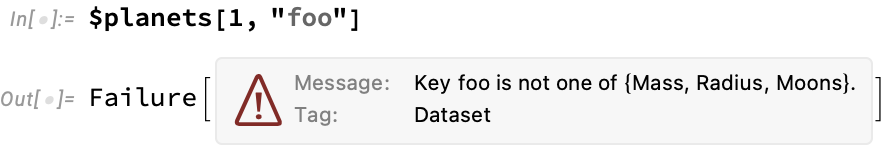
The main way to operate on Dataset-encapsulated data is with query syntax, which extends Mathematica’s general-purpose Part syntax, also written [[...]]. Queries consist of a list of operators that apply at successively deeper levels of a dataset, transforming the data as they go. Similar to display widgets, these form a kind of compositional machinery that transforms data in well-defined ways. The type system behind Dataset is able to reason about how such queries will act on data, and reject queries that will produce malformed results. For example, if we extract a non-existent part of the planets dataset, we will get an error:
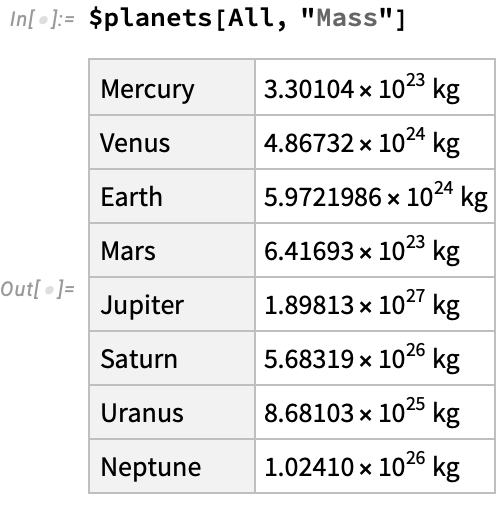
Valid queries produce new datasets:
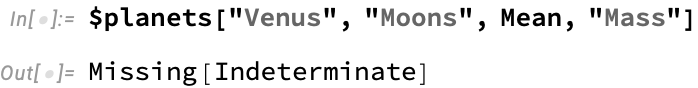
We can combine aggregation operations with simple part extraction. Unlike slicing operators, which act “on the way down”, aggergation operators act “on the way up” as we return from recursive computations:
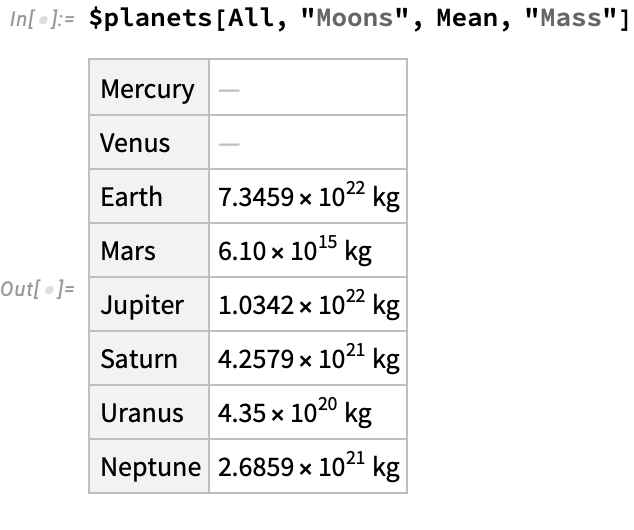
This displays an interesting aspect of these aggregation operations: the mean of an empty list is the special Missing[...] Mathematica value, which sidesteps the type system entirely and is considered a valid instance of any type. Missing is a general carrier of exceptional behavior that allows us to keep working when certain parts of the data fail the strict requirements for operations like Mean to be defined:
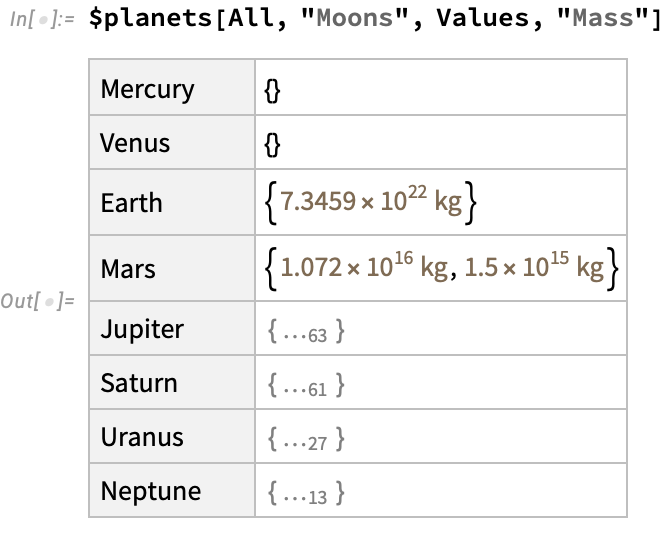
Let’s look at another operation, in which we just take the values of moon masses, turning an association of masses into a simple list of values:
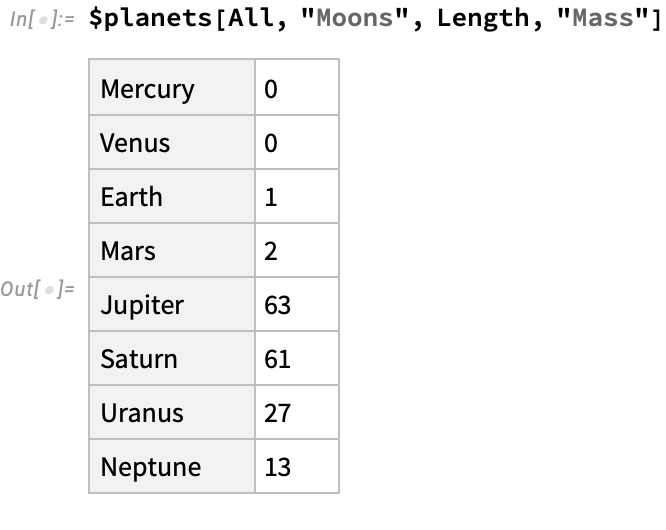
We are not limited to simple aggregations. We can perform arbitrary functions as well:
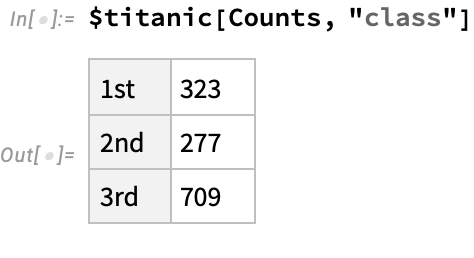
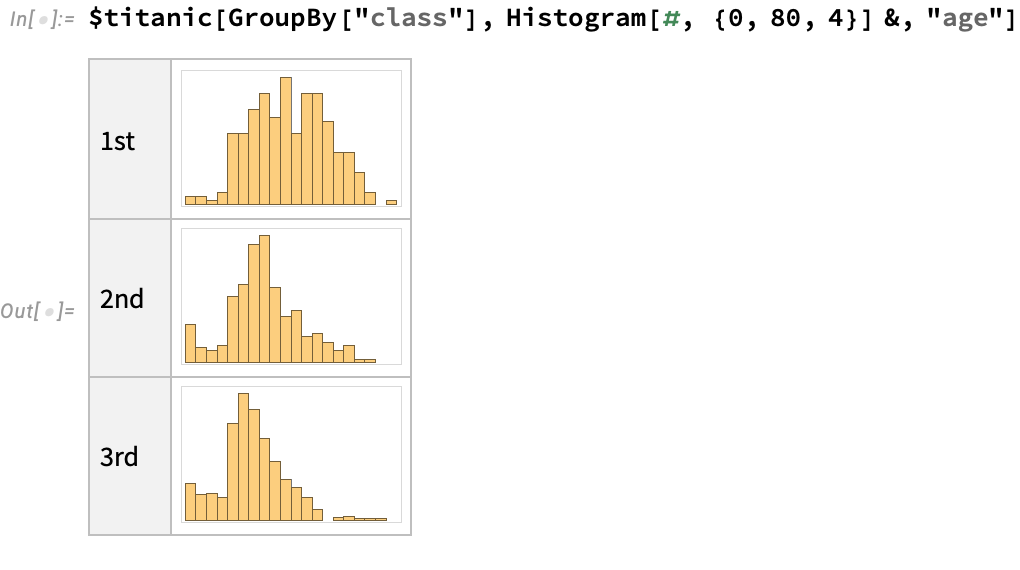
This is especially useful when we want to do basic data-science type operations. For example, we can count the number of passengers in each class on the titanic:
Or create an age histogram split by class:
Under construction…
Type inference and deduction
Under construction….
Future work
Under construction….